

Upflow → Blog → Reduce DSO
DSO Formula: How to Calculate, Benchmark & Improve
Alexandre Antoine
|
October 8, 2026
Generate AI summary


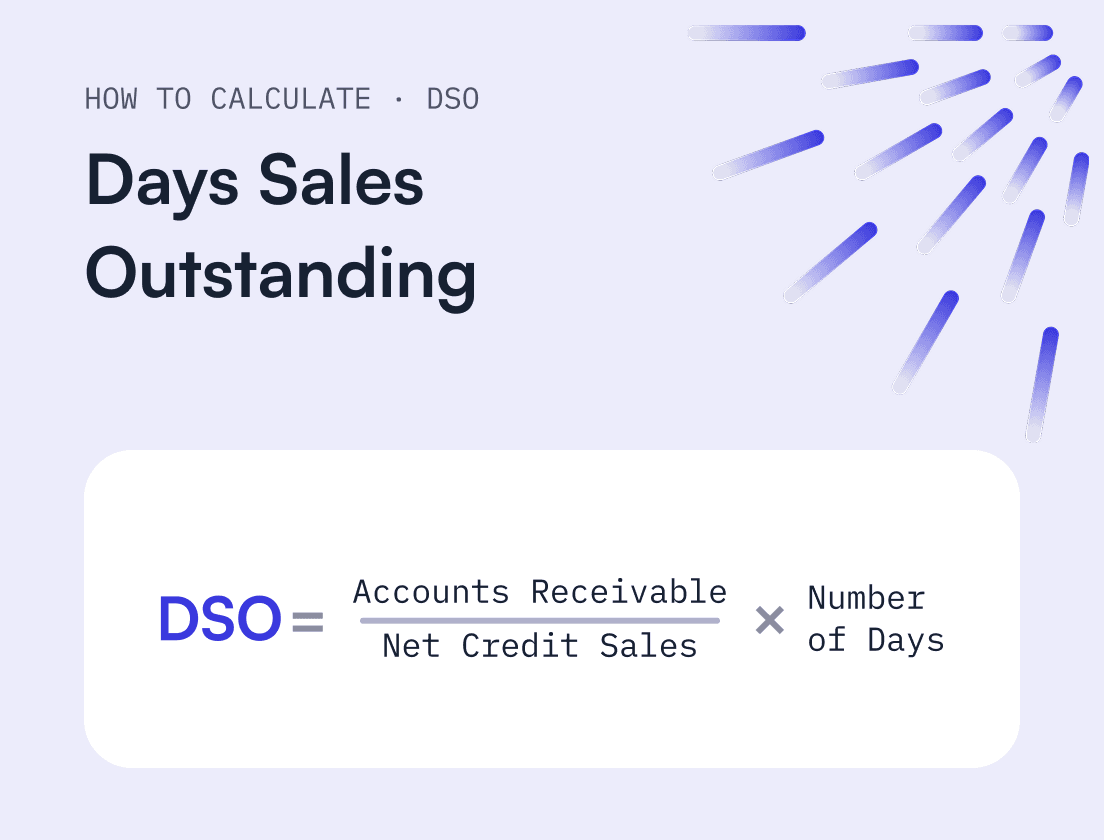
Days Sales Outstanding (DSO) measures how many days it takes your business to collect payment after issuing an invoice. The standard DSO formula is: DSO = (Accounts Receivable ÷ Total Credit Sales) × Number of Days.
A rising DSO means more of your cash is tied up with customers, which puts pressure on cash flow even when sales are growing. There are two ways to calculate it: the simple method, which gives a quick average for a period, and the countback method, which is more accurate for businesses with seasonal or uneven revenue. Most CFOs use the countback method. In this guide, you’ll learn:
- The Simple Formula to Calculate DSO
- The Countback Method DSO Formula (With Example)
- Benefits of the Countback Method to Calculate DSO
- How to Calculate DSO in Excel (With a Free DSO Calculator)
- DSO Benchmarks by Industry: What Is a Good Days Sales Outstanding
- DSO vs DPO: What’s the Difference?
- Steps to Reduce Your DSO
Want to calculate your DSO before diving deeper? Try our free DSO calculator spreadsheet and calculate your DSO in minutes.

The Simple Formula to Calculate DSO
The simple DSO formula divides your accounts receivable by your credit sales for a period, then multiplies the result by the number of days in that period. It’s the quickest way to get a reliable average, and the version most finance teams start with.
Simple DSO Formula (With Step-by-Step Example)
The simple method is the most straightforward way to calculate days sales outstanding. You need two numbers from the same period: your accounts receivable balance at the end of the period, and your total credit sales over that period.
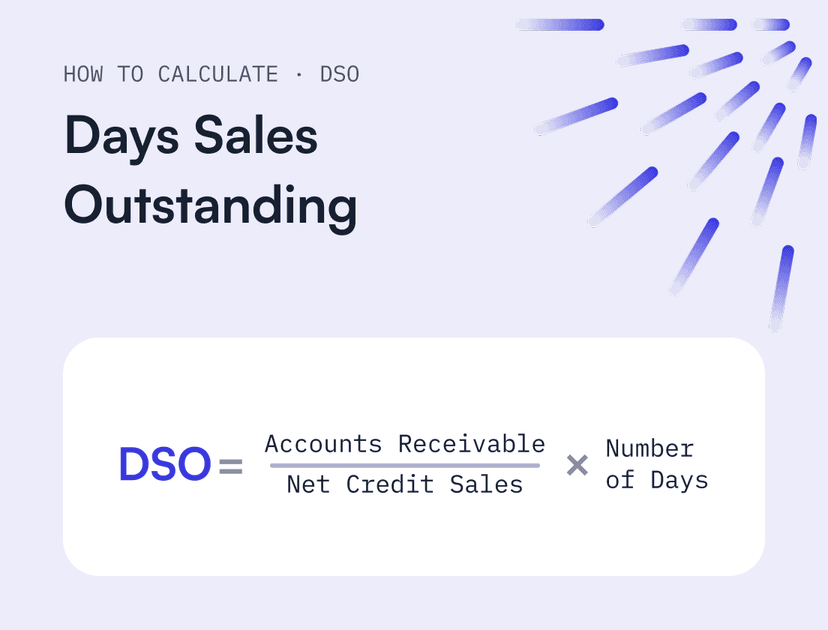
Simple DSO formula: DSO = (Accounts Receivable ÷ Total Credit Sales) × Number of Days
Here’s how that looks laid out:
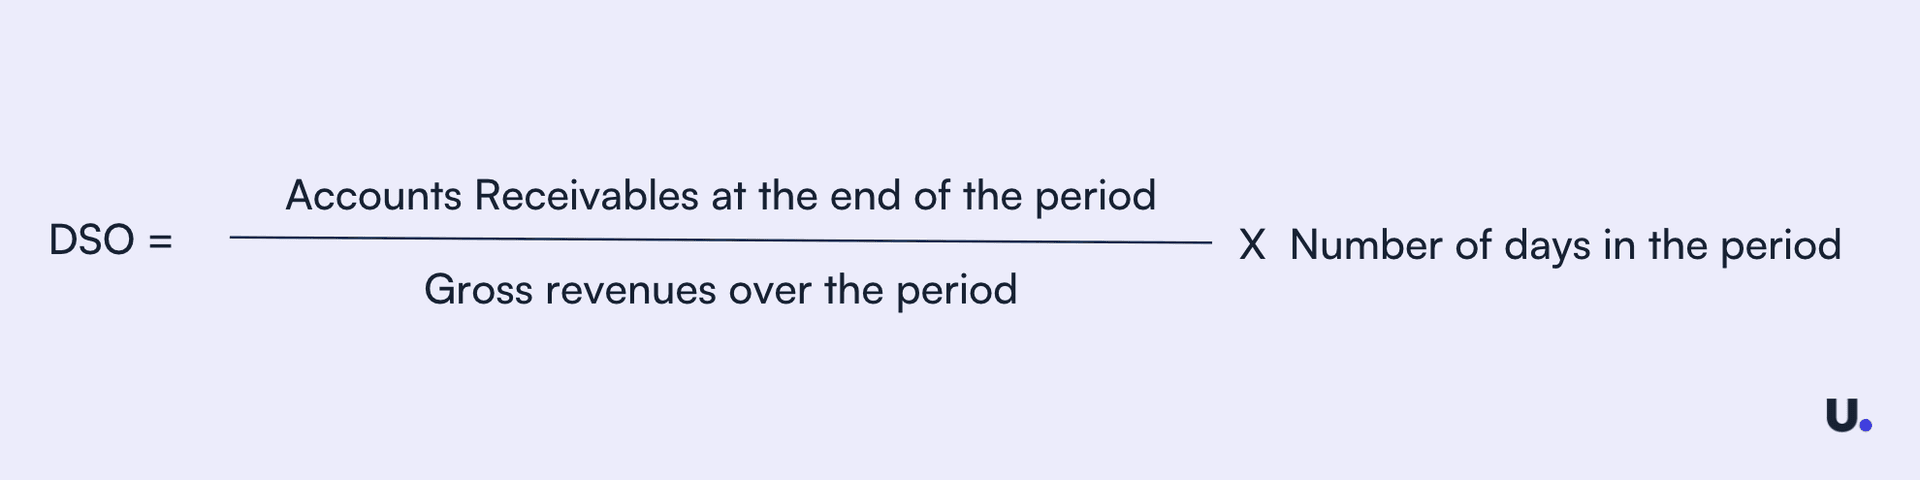
Let’s take a quick example:
- Your credit sales for the year are $2,000,000.
- Your accounts receivable at year-end are $200,000.
Using the simple method, your DSO would be ($200,000 ÷ $2,000,000) × 365 = 36.5 days.
That means that over the year, it took your business 36.5 days on average to get paid.
Whether that’s low or high depends on your industry. Track it over time and you’ll learn what’s normal for your business, and spot changes early.
How to Calculate DSO for a Month, Quarter or Rolling 12 Months
The formula stays the same for any period. Only two things change: the credit sales figure you use, and the number of days you multiply by. Always take accounts receivable from the last day of the period.
| Period | Credit sales to use | Number of days | Example | DSO |
|---|---|---|---|---|
| One month | Credit sales for that month | 28, 30 or 31 | AR $200,000, March sales $180,000 | ($200,000 ÷ $180,000) × 31 = 34.4 days |
| One quarter (3 months) | Credit sales for the 3 months | 90, 91 or 92 | AR $200,000, Q1 sales $520,000 | ($200,000 ÷ $520,000) × 90 = 34.6 days |
| Rolling 12 months | Credit sales for the last 12 months | 365 | AR $200,000, trailing 12-month sales $2,000,000 | ($200,000 ÷ $2,000,000) × 365 = 36.5 days |
Monthly DSO reacts quickly but can jump around when sales are uneven. A large invoice at the end of the month can push it up even if collections haven’t changed. Rolling 12-month DSO smooths that out, which makes it the better number for spotting real trends and reporting to the board. Many finance teams track both, using monthly DSO for day-to-day collections work and rolling DSO for the bigger picture.
Limitations of the Simple DSO Formula
The simple formula gives you an average, and an average can hide what’s really happening. It assumes sales and collections are spread evenly across the period, which is rarely true.
If your sales are seasonal, the simple method will be off. For example, if your business slows down in August or does little in December, a yearly DSO will blend those months with your busy ones and give you a number that doesn’t match any of them.
You can get closer by calculating DSO for shorter periods and comparing them, but that takes more work and is still an approximation. The countback method solves this by looking at each month’s actual sales against what’s still unpaid.
The Countback Method DSO Formula (With Example)
The countback method calculates DSO by working backward from your most recent month. You subtract each month’s credit sales from your accounts receivable balance until it runs out, adding up the days as you go. It’s more accurate than the simple formula because it looks at the sales that actually created your outstanding invoices, instead of an average across the whole period.
Countback DSO formula
Starting from the most recent month, subtract each month’s credit sales from your accounts receivable balance. For every month where the remaining AR is higher than that month’s sales, add the full number of days in the month. For the last month, add (Remaining AR ÷ That Month’s Credit Sales) × Days in That Month.
You need two things from your books: your accounts receivable balance at the end of the most recent month, and your credit sales for each month before it. Then follow these steps:
- Start with your current AR balance and set your DSO at 0.
- Compare it with the most recent month’s credit sales. If your AR is higher, add all the days in that month to your DSO, subtract that month’s sales from your AR, and move back one month.
- Repeat for each earlier month until you reach a month where the remaining AR is lower than that month’s sales.
- For that final month, add a partial month: (Remaining AR ÷ That Month’s Credit Sales) × Days in the Month.
- Add up the days. The total is your DSO.
Here’s an example, counting back from the end of July:
| Step | Month | Remaining AR | Credit sales | Days added | Running DSO |
|---|---|---|---|---|---|
| 1 | July (31 days) | $11,000 | $3,000 | 31 | 31 days |
| 2 | June (30 days) | $8,000 | $1,000 | 30 | 61 days |
| 3 | May (31 days) | $7,000 | $10,000 | ($7,000 ÷ $10,000) × 31 = 21.7 | 82.7 days |
In July, your AR of $11,000 is higher than July’s sales of $3,000, so you add all 31 days. Then subtract July’s sales: $11,000 – $3,000 = $8,000 left to account for.
In June, the remaining $8,000 is still higher than June’s sales of $1,000, so you add all 30 days, bringing DSO to 61. Subtract again: $8,000 – $1,000 = $7,000 left.
In May, the remaining $7,000 is lower than May’s sales of $10,000, so you only add part of the month: ($7,000 ÷ $10,000) × 31 = 21.7 days.
Your DSO is 31 + 30 + 21.7 = 82.7 days. That’s how long it’s taking, on average, to turn your invoices into cash.
To see why the method matters, run the same numbers through the simple formula over the three months: ($11,000 ÷ $14,000) × 92 = 72.3 days. Sales were unusually low in June and July, and the simple average hides that, so it understates your DSO by more than 10 days.
Benefits of the Countback Method to Calculate DSO
This days sales outstanding formula is more complex, but it’s also more accurate. That’s why most CFOs and finance teams use it to report their company’s DSO.
Unlike the simple method, it doesn’t rely on an average across the whole period. Because it counts back through the months that actually created your receivables, the result reflects how long you’re really waiting to get paid, month by month or period by period. Seasonal dips and one-off spikes in sales don’t distort it the way they distort the simple formula.
Once you have your DSO, you can benchmark it against your industry to see whether you’re collecting faster or slower than similar companies. If your competitors publish their accounts, you can even calculate their DSO and compare.
You can also use it to track your financial health over time, for example to see how a change in payment terms, pricing or customer mix affects how quickly you get paid.
The downside is the number of calculations involved, especially if you want to track DSO every month. The good news is that once you can measure it reliably, you can set up a strategy to reduce it.
How to Calculate DSO in Excel (With a Free DSO Calculator)
To calculate DSO in Excel, put your accounts receivable, credit sales and number of days in separate cells, then use =AR/Sales*Days. For the countback method, list your months from most recent to oldest and use one formula to track the remaining AR and another for the days added each month. Both take a few minutes to set up.
Simple DSO Formula in Excel
Set up one row per period:
| A | B | C | D | E | |
|---|---|---|---|---|---|
| 1 | Period | Accounts receivable | Credit sales | Days | DSO |
| 2 | 2025 | 200,000 | 2,000,000 | 365 | =B2/C2*D2 |
The result in E2 is 36.5 days. To calculate monthly DSO instead, enter the last day of the month in column A and use =DAY(EOMONTH(A2,0)) in column D to get the number of days automatically.
Countback DSO Formula in Excel
List your months with the most recent at the top. Enter your current AR balance in D2 only, and let the formulas do the rest:
| A | B | C | D | E | |
|---|---|---|---|---|---|
| 1 | Month | Credit sales | Days | Remaining AR | Days added |
| 2 | July | 3,000 | 31 | 11,000 | =IF(D2<=0,0,IF(D2>=B2,C2,D2/B2*C2)) |
| 3 | June | 1,000 | 30 | =MAX(D2-B2,0) | copy E2 down |
| 4 | May | 10,000 | 31 | copy D3 down | copy E2 down |
Copy both formulas down for as many months as you need, then add up column E with =SUM(E2:E13) to get your DSO. With the example numbers, that gives 31 + 30 + 21.7 = 82.7 days, the same result as the worked example above.
If you’d rather skip the setup, try Upflow’s free DSO calculator. It has both the simple and countback methods built in, so you only need to add your own numbers.
Automating Your DSO Calculation
Excel works well for a one-off calculation. It gets harder when you want to track DSO every month:
- It’s easy to make mistakes. One wrong cell reference or a month copied in the wrong order changes the result, and nothing flags it.
- The data goes out of date quickly. You have to export AR and sales from your accounting system each time, and the figure is only as current as your last export.
- It doesn’t show what’s behind the number. A spreadsheet tells you DSO went up, but not which customers or invoices caused it.
The more reliable option is to use the countback method and let software run it for you. Accounts receivable automation software like Upflow connects to your ERP or accounting system and calculates DSO automatically, using the countback method. Upflow keeps it up to date as invoices are paid, and lets you break it down by customer, segment or period to see where delays come from.
That frees up the time you’d spend rebuilding spreadsheets, and lets you track DSO alongside your other key financial metrics without extra work.
Before working on reducing your DSO, it helps to know what a good DSO looks like for your industry, since payment norms vary widely between sectors.
DSO Benchmarks by Industry: What Is a Good Days Sales Outstanding
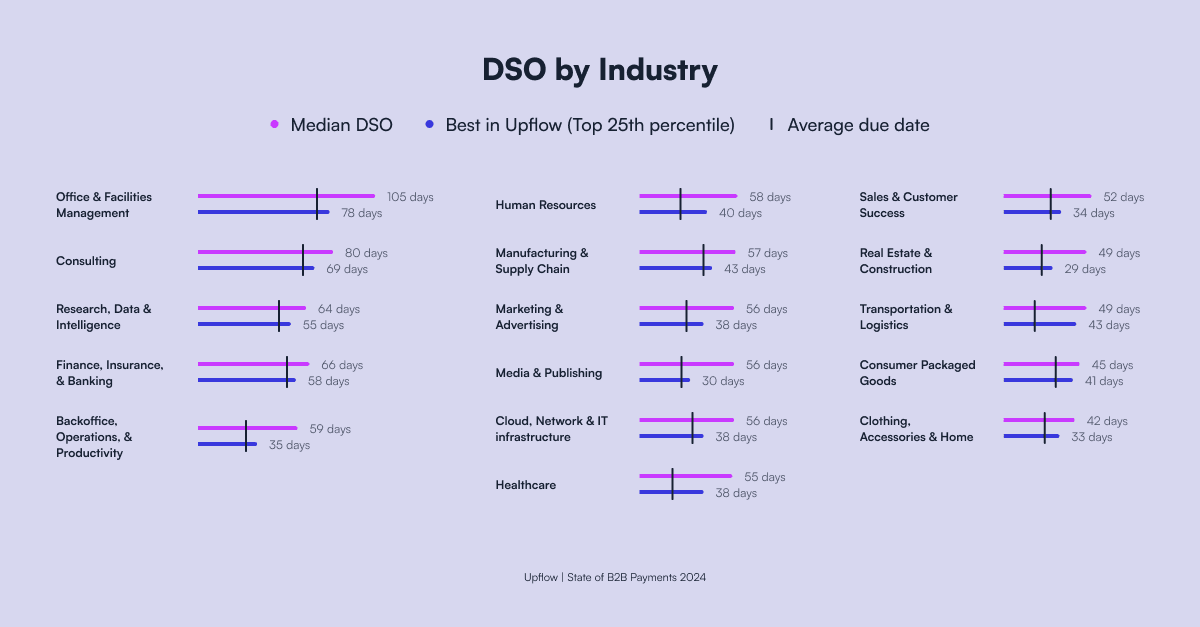
A good DSO is one that’s close to your standard payment terms and at or below the median for your industry. Across industries, the median DSO is 56 days, but it ranges from around 42 days in retail-style businesses to over 100 days in facilities management. If your DSO is well above your payment terms, customers are paying late, whatever your industry.
Looking beyond simple averages, the chart below shows the median DSO by industry, alongside the DSO of the best-performing companies in each sector. Use these benchmarks to see how your days sales outstanding compares with other companies in your space.
| Industry | Median DSO | Best in Upflow (top 25%) |
|---|---|---|
| Office & Facilities Management | 105 days | 78 days |
| Consulting | 80 days | 69 days |
| Finance, Insurance & Banking | 66 days | 58 days |
| Research, Data & Intelligence | 64 days | 55 days |
| Backoffice, Operations & Productivity | 59 days | 35 days |
| Human Resources | 58 days | 40 days |
| Manufacturing & Supply Chain | 57 days | 43 days |
| Marketing & Advertising | 56 days | 38 days |
| Media & Publishing | 56 days | 30 days |
| Cloud, Network & IT Infrastructure | 56 days | 38 days |
| Healthcare | 55 days | 38 days |
| Sales & Customer Success | 52 days | 34 days |
| Real Estate & Construction | 49 days | 29 days |
| Transportation & Logistics | 49 days | 43 days |
| Consumer Packaged Goods | 45 days | 41 days |
| Clothing, Accessories & Home | 42 days | 33 days |
According to our State of B2B Payments in 2024 report, the overall median DSO across industries is 56 days. That headline number is useful, but the spread between sectors matters more, since some industries collect much faster than others.
Traditional service categories like Office and Facilities Management and Consulting tend to post higher DSOs, often because 90-day payment terms are common. Even so, median performers in Office and Facilities Management often struggle to get customers to stick to those terms. The top quartile of companies in that sector, which we call the best in Upflow, bring DSO down to 78 days, meaning they collect well within their agreed terms.
At the other end of the spectrum, Clothing, Accessories and Home businesses show the lowest median DSO on Upflow. One likely reason is the cash tied up in physical inventory, which pushes teams to secure payment quickly after each sale. They can also enforce payment more directly by controlling credit exposure, since customers may not receive their next order until outstanding invoices are settled. That kind of leverage is harder in sectors like Office and Facilities Management, where services can’t easily be paused.
To make these benchmarks useful, calculate your own DSO first, using the same method each time so the numbers stay comparable. It also helps to look at DSO next to the other side of your working capital: how long you take to pay your own suppliers.
DSO vs DPO: What’s the Difference?
DSO (days sales outstanding) measures how long your customers take to pay you. DPO (days payable outstanding) measures how long you take to pay your suppliers. One tracks cash coming in, the other cash going out, and together they show how much of your operations you’re funding while you wait to get paid.
The two formulas follow the same logic:
- DSO = (Accounts Receivable ÷ Total Credit Sales) × Number of Days
- DPO = (Accounts Payable ÷ Cost of Goods Sold) × Number of Days
Some companies use total purchases instead of cost of goods sold for DPO, especially service businesses with few direct costs. Whichever you choose, use the same method every time so the numbers stay comparable.
| DSO | DPO | |
|---|---|---|
| What it measures | How long customers take to pay you | How long you take to pay suppliers |
| Based on | Accounts receivable | Accounts payable |
| A higher number means | Cash is tied up with customers for longer | You hold on to cash for longer |
| What most teams aim for | Lower | Steady, within agreed supplier terms |
DSO and DPO also make up two parts of the cash conversion cycle, which measures how many days your cash is tied up in operations:
Cash Conversion Cycle = DSO + DIO – DPO
DIO (days inventory outstanding) is the time it takes to sell your inventory. For service and software businesses with no inventory, DIO is zero, so the cycle is simply DSO minus DPO.
For example, if your DSO is 45 days and your DPO is 30 days, and you hold no inventory, your cash conversion cycle is 15 days. You’re paying suppliers 15 days before your customers pay you, and that gap has to be funded from your own cash. Tracking both numbers as part of your cash flow analysis shows how much cash that gap ties up as you grow.
It’s tempting to close the gap by paying suppliers later, but stretching DPO too far strains those relationships and can cost you early payment discounts. Bringing DSO down is usually the healthier lever, and it’s the one you control through your own invoicing and collections.
Steps to Reduce Your DSO
To reduce DSO, focus on five areas: clear payment terms, accurate invoices sent on time, easy ways to pay, consistent follow-ups, and a credit policy based on how customers actually pay. Most of the gains come from removing friction rather than chasing harder. For a deeper playbook, our guide on how to reduce DSO covers each area in detail.
1) Tighten payment terms and set expectations early
Reducing DSO starts before the invoice goes out. Put your payment terms in proposals, order forms and contracts, repeat them on every invoice, and confirm who approves invoices on the customer’s side.
2) Fix the invoicing fundamentals and bill faster
Send invoices as soon as work is delivered, with the right PO or reference number, clear line items and the due date. Standardized templates and workflows stop invoices from slipping, especially at month-end.
3) Make paying effortless
Customers pay faster when paying is easy. Offer several payment methods, such as card, bank transfer and direct debit, and include a payment link in every invoice and reminder.
4) Automate follow-ups and prioritize the right accounts
Send payment reminders automatically before and after the due date, then escalate step by step, from email to call to a senior contact. Focus your team’s time on high-value accounts and repeat late payers.
5) Strengthen your credit and collections strategy with the right metrics
Not every DSO problem is a collections problem. Set credit limits and terms based on payment history, and track AR aging, dispute rates and Collection Effectiveness Index (CEI) to see where delays start.
Upflow helps you apply these steps end to end, from faster invoicing and easier payments to automated follow-ups and real-time AR visibility, so DSO comes down with less manual work.


Alexandre Antoine
Finance Director at Upflow
Alexandre is the Finance Director at Upflow, where he leads the company’s internal finance and accounting operations. With a background in both strategic finance and financial reporting, Alexandre brings a practical, detail-oriented approach to the complexities of B2B finance.
At Upflow, Alexandre ensures that internal processes from cash management to KPI reporting are optimized for transparency, accuracy, and growth-readiness. He helps build scalable finance systems that support Upflow’s mission to empower other finance teams through better collections and cash flow insights.
Alexandre regularly contributes to Upflow’s blog with in-depth articles on accounting metrics, financial ratios, reporting best practices, and operational benchmarks. His writing provides actionable advice for controllers, FP&A teams, and finance leaders navigating complex financial processes.

Summary

Shared
Frequently Asked Questions
Can’t find what you’re looking for?
Ask AI
The simple DSO formula is DSO = (Accounts Receivable ÷ Total Credit Sales) × Number of Days. Use your accounts receivable balance at the end of the period and your credit sales for the same period. For example, $200,000 in AR and $2,000,000 in annual credit sales gives ($200,000 ÷ $2,000,000) × 365 = 36.5 days.
The two common methods are the simple method and the countback method. The simple method gives a quick average across a chosen period. The countback method works backward month by month, subtracting each month’s sales from your AR balance, which makes it more accurate when sales are seasonal or uneven.
Use the same formula with a quarter’s figures: divide your accounts receivable at the end of the quarter by your credit sales for the 3 months, then multiply by the number of days in the quarter (90, 91 or 92). For example, $200,000 in AR and $520,000 in quarterly credit sales gives ($200,000 ÷ $520,000) × 90 = 34.6 days.
Days receivable outstanding, AR days outstanding and days sales outstanding are different names for the same metric, and they use the same formula: (Accounts Receivable ÷ Total Credit Sales) × Number of Days. It measures how long it takes, on average, to collect payment after a sale on credit.
Some teams calculate DSO using average accounts receivable instead of the closing balance: (Beginning AR + Ending AR) ÷ 2, divided by credit sales for the period, multiplied by the number of days. This smooths out a large invoice or payment landing at the end of the period. Whichever version you use, keep it consistent so your DSO trend stays comparable over time.
Put your accounts receivable, credit sales and number of days in separate cells, then use =AR/SalesDays, for example =B2/C2D2. For the countback method, list months from most recent to oldest, track the remaining AR in one column and the days added in another, then sum the days. Upflow’s free DSO calculator has both methods set up.
A good DSO is close to your standard payment terms and at or below the median for your industry. Upflow’s data puts the overall median at 56 days, ranging from around 42 days for clothing, accessories and home businesses to 105 days for office and facilities management. If your DSO is well above your payment terms, customers are paying late, whatever your industry.
Set clear payment terms early, send accurate invoices as soon as work is delivered, make paying easy with payment links and several payment methods, and automate reminders with a clear escalation path. Then review credit terms and track AR aging and CEI to find where delays start.
Related articles