

If you want to know what’s really going on in your business, you have to look at your data.
The same goes for your accounts receivable collection: if you want to know how well you perform, you have to look at specific metrics.
Knowing where you stand will help you know where to focus your team’s efforts. In the long run, tracking your AR metrics will help optimize your collections process (and have tangible proof of it).
Overall, it ensures your cash flow management is optimal.
Here are the essential KPIs you should be tracking:
Collection Effectiveness Index (CEI)
Best possible DSO
Average Day Delinquent (ADD)
Days Sales Outstanding (Having trouble calculating it? Check out our free spreadsheet!)
Learn more about the 5 Key Accounts Receivable Metrics to Assess Your AR Performance
Today, let’s focus on how best to track these key performance indicators. With many key metrics to track and various methods to calculate each of them - it can get overwhelming. Especially if you do it all manually.
Keep reading to find the best way to track your KPIs for accounts receivable!
Spoiler alert: the best way involves using an automated solution like Upflow, our in-house software. Try out our Discover Plan for free!

The Problem with Tracking your Accounts Receivable KPIs Manually (Or Why Spreadsheets Aren’t Enough).
Before we jump into the best way to track your accounts receivable metrics, let’s have a look at the other options, starting with using spreadsheets.
Spreadsheets Results Aren’t Accurate
All Cfos and finance teams use a form of spreadsheets in their job - that’s a given. But while they are definitely valuable, they’re not always the best option.
In fact, when it comes to tracking KPIs, using Excel can lead to inaccurate results.
For one, there is the human factor. There is always the risk of a typo finding its way into a table or a formula. Sometimes it’s obvious and you have to spend time looking for the mistake. Sometimes it’s not, and you’re just basing your decisions on false information.
To calculate your metrics, you need relevant data. For CEI measures for instance, you’ll need your:
Beginning receivables,
Monthly sales,
Total receivable at the end of the period,
Current receivables.
That’s a lot of data to chase after. Especially when it keeps changing!
Switching between different software dashboards, bank accounts’, tabs, etc. doesn’t make the process easier. Especially as there is no guarantee this data is actually the latest available.
If you want to have up-to-date results, you need up-to-date data. And using Excel doesn’t provide that. Most of the time, spreadsheets aren’t in real time. This means you need to manually update data to have an accurate report.
Tracking Your KPIs Manually isn’t The Best Use of Your Time.
Even if you do manage to find the most accurate data, using spreadsheets isn’t the best use of your time.
Once the data chase is over (and is it really ever over?) - you still have to compute all of that manually. If you want to compare different time periods, you then have to start all over again. Producing graphs or reports takes some extra time, too.
Let’s not even talk about doing a benchmark of all your performance metrics altogether - how much time would that take you?
The bottom line is that spreadsheets don’t make it easy to calculate and track your KPIs for accounts receivable over time. All the necessary tasks take a lot of time out of your day.
That’s time that’s not used to make decisions regarding your strategic long-term growth, or implementing said strategy.
Automation and dedicated AR tools are the way to go if you want to track (and improve!) your collection performance.
Tracking your AR Metrics with your Billing Tool.
When it comes to choosing automation, you might want to use a tool you already use. Billing tools, or accounting software in general, often come with some kind of analytics features.
While it makes sense to keep your finance stack lean to drive revenue expansion, it’s not the best option to track your KPIs for accounts receivable specifically.
Billing tools and accounting software have the advantage of centralizing your data and, therefore, being your one source of truth.
You know if an invoice is marked as paid, then the money is very likely in your bank account. If your software is operating in real-time (not synchronizing once or twice a day), it’s a bonus.
However, billing software is often just that: billing software. It might have some metrics tracking functionality, but it’s not specialized in accounts receivable.
It makes a huge difference when it comes to
The metrics they show,
The depth of features they offer,
The analysis you can draw from the data.
Because these solutions are by design incomplete for tracking KPIs for accounts receivable, you’d need to switch between different tools.
Maybe your billing software shows your net credit sales, but your total credit sales will be found on your account software only. To compute them to get your sales ratio, you’d need to open a spreadsheet… And you’re back to juggling different tools to do one calculation.
Put simply, nothing will ever do the job of an AR software - which is why you have AR software like Upflow in the first place. Those AR-focused tools offer all the features you need, not just the ones that are nice to have but don’t give you much depth.
With AR automated software, you have the option to filter your reports, zoom in on some metrics, and actually set up reminders for your team to follow through on an invoice.
Choose the AR software that best suits your current and future needs: for example, we offer real-time dashboards whereas other tools sync only once or twice a day.
Need help tracking your main AR metrics? Have a look at our free spreadsheet!

Building an Internal Tracking System for your AR Metrics.
Another option that is often considered by CFOs is to build their own tracking system. Instead of using someone else’s dashboards, they decide to create their own.
It allows for more personalization as this new system can be 100% customized to their needs. It’s great in theory, but practically, it can quickly become nightmarish.
It’s Difficult to Plan for your Future Needs.
To build your own AR tracking system, you first need to map out your exact needs during various meetings with your internal developer team (or hire this out). That in itself can be a challenge, especially as you don’t know how your needs will evolve.
Maybe your company will merge with another entity, or maybe your core business activities will slightly vary.
Any natural evolution of your business will need you to adapt your tracking system. That’s also true for all the documentation, FAQ, and training that your company’s employees will have to go through - possibly several times.
It’s Not Time or Cost Efficient.
By building their own system, managers think that they’ll be able to make all the decisions quickly.
But the truth is that your project might not be a priority. That’s true whether you externalize this project or entrust it to your own developers. IT teams are pretty busy in general, so you’d have to rely on someone who’s constantly juggling tasks for your project.
Once it’s done, you might need some extra features developed or bugs corrected in the future. That’ll be an additional waiting time, plus explaining your system all over again, and starting another operation.
The time alone dedicated to project managing this would be better used elsewhere. You also need to consider the cost: direct if you hire out, or the opportunity cost of your team who could be working on another project.
All in all, building your own tracking system takes time and energy that could be put elsewhere. It will take a lot of time and resources to build and most importantly, to maintain it.
Building AR Automation Is Not Your Job.
In addition to having to manage this new system and its surrounding content, building your own dashboard means taking on a huge responsibility.
If there is ever a problem (which, let’s be honest, tends to happen a lot in tech), you’d have to be the one solving it. Maybe it’s a problem with the servers, maybe your data doesn’t synchronize anymore. Whatever it is, it’ll be your IT team’s responsibility to find it and fix it.
And while you do that… your team probably will have to convert back to using manual spreadsheets.
It’s better (and more relaxing!) to outsource this part of your activity to professionals. People whose job it is to design AR automation, who you can rely on to fix any technical problem, answer your questions, and provide training to your collaborators.
Your team’s job is finance and accounts receivable management. Ours is offering and maintaining a great A/R product.
AR Software to Track Your AR Metrics: The Best Way to Go!
Benefits of Using an AR specialized tool to track your AR Metrics.
Dedicated software is hands down the best option to track the KPIs for accounts receivable. It is the most efficient way to gather your data, analyze it, and actually do something about it.
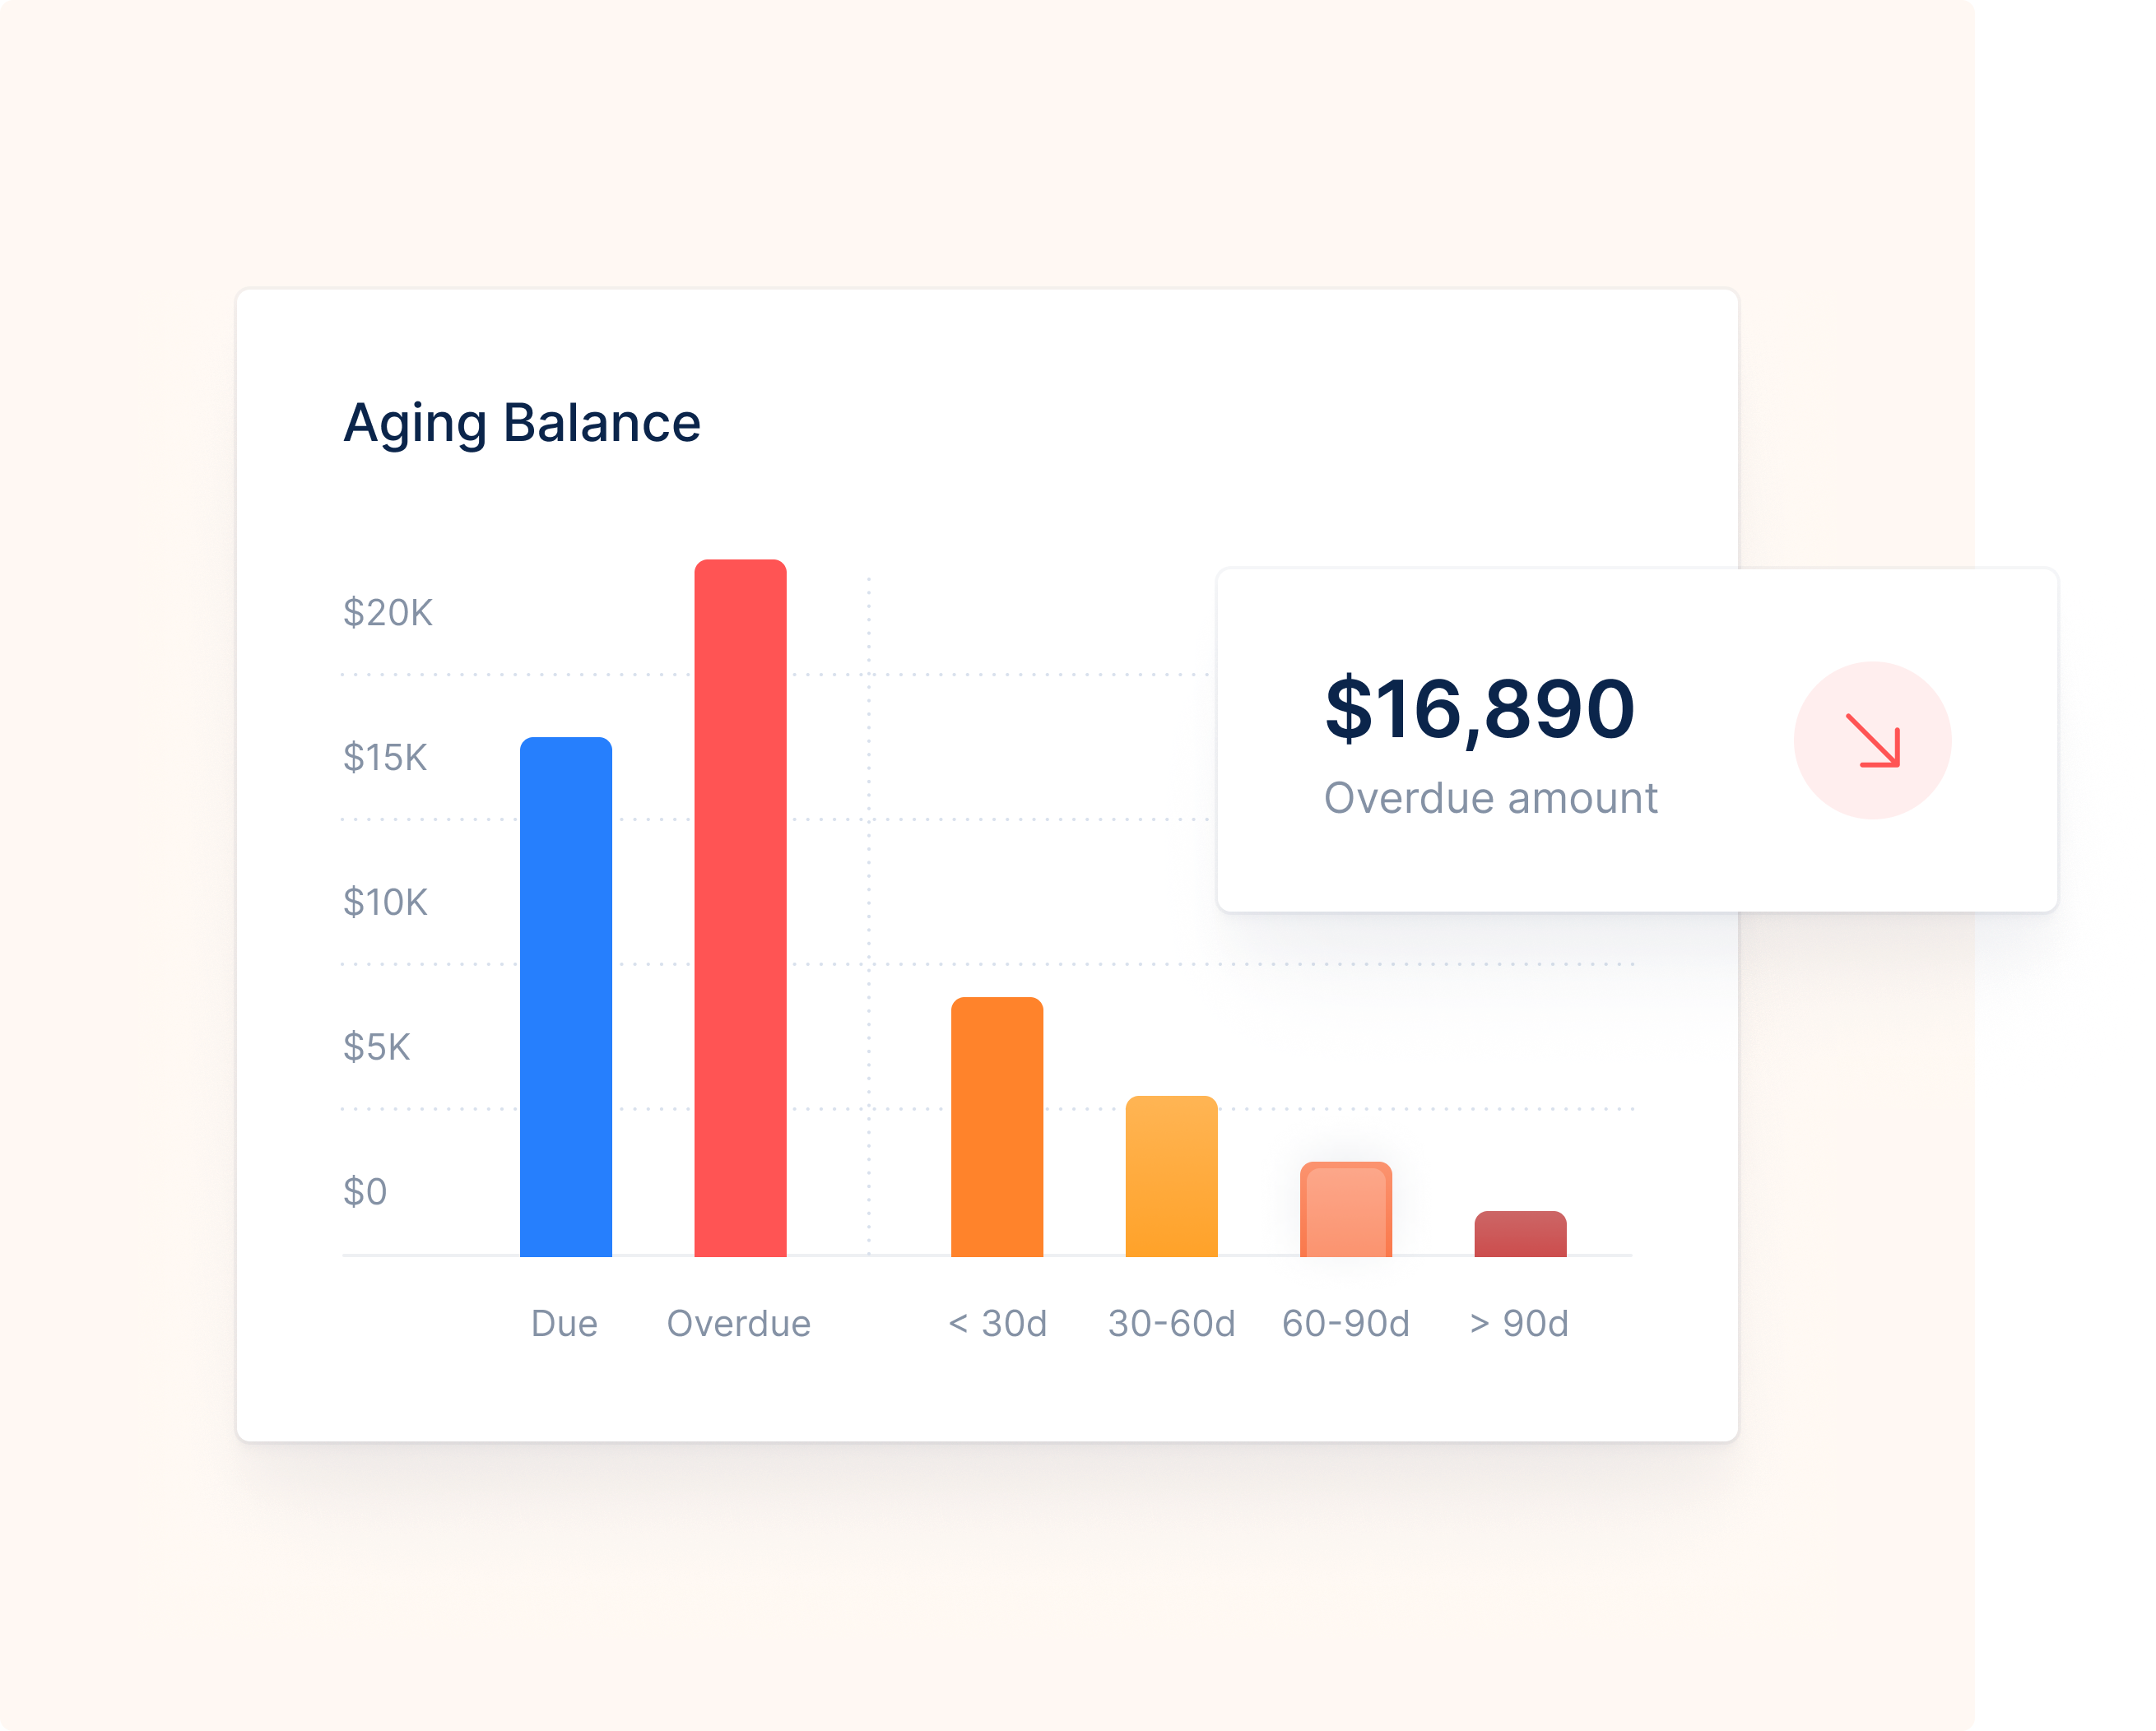
AR software are metric-centered. On Upflow for example, you can instantly access live reports that will show you how your cash collection is going. In a few clicks, you’ll access billing cohorts, DSO and aging balance. Below for example, you can see an example of Aging Balance on Upflow.

The good news it, you can go further in your analysis. For example, if you click on you billing cohorts, you’ll be able to identify directly the accounts that are risk and take action. More numbers, more details and more accuracy.
On top of tracking your main KPIs, you can also use AR software to prioritize and improve your collection efforts, thanks to the visibility provided by your KPI reports.
What will come in handy is the ability to centralize your whole collection process on it.
For example, Upflow integrates with your existing finance stack, meaning that your data from your other software will be automatically synchronized on it. That ensures that your results are always accurate and in real-time.
You can also set up workflows to send automated payment reminders to your clients. Those can be used after their invoice due date, or even before. It’s all up to you, and the emails are entirely personalizable. You can also decide to use one of our email templates.
By automating your most repetitive tasks (like calculating metrics or sending follow-up emails), you can focus on the actions that have a real added value.
Maybe your metrics will indicate that you need to review your collection policies to prevent your unpaid invoices from turning into bad debt. Whatever it is, your whole team’s performance will increase. Making your accounts receivable process even more efficient at ensuring your company’s liquidity.
Using Upflow for your AR Metrics.
Using software also means less worrying about calculating your metrics, and more time spent analyzing said metrics. That’s key to improving your accounts receivable performance!
Let’s have a look at some of the metrics you’ll find on Upflow Analytics, and why they matter:
Optimizing your Days Sales Outstanding (DSO) with Upflow or our free tool.
Your DSO is the average number of days it takes you to get paid. It’s one of the most important KPIs for accounts receivable. A high DSO means your credit policies are too lenient, threatening your liquidity shortage. It has to be closely monitored over time.
The main hurdle with DSO is to actually calculate it. You can use either the simple method or the countback method. The latter is more accurate but also more time-consuming.
The good thing about using automation is that you don’t have to choose between effectiveness and accuracy. Upflow uses the most accurate formula to calculate your DSO, automatically. You can see what it looks like below.

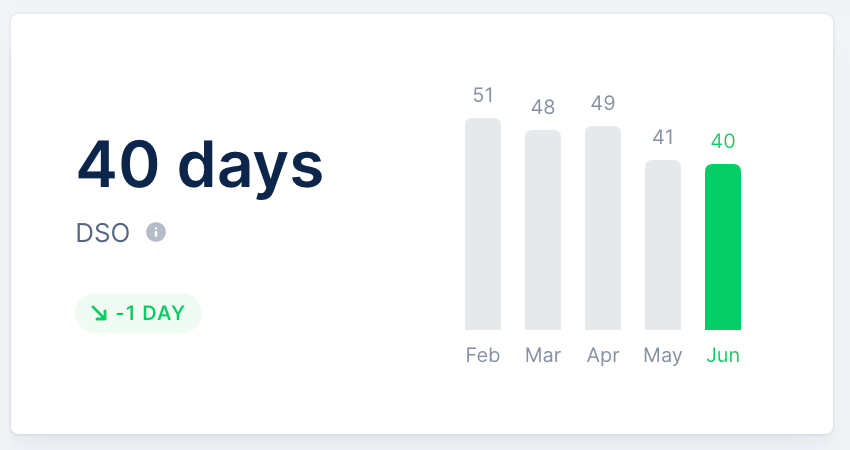
You’ll therefore be able to track your DSO over a time-period easily. Automation with Upflow makes it easy to focus on what’s most important: your company’s liquidity.
Keeping an Eye on Your Aging Balance With Upflow.
Your aging balance is a visual representation of your unpaid invoices, split into different buckets:
0 to 30 days overdue,
30 to 60 days overdue,
60 to 90 days overdue,
+90 days overdue.
At a glance, you can see in which bucket your invoices are piling up in. It gives you an immediate sense of where to focus your collection efforts.
We recommend focusing on the 60-90 days category to prevent any future liquidity problems. Aging balances are helpful to help you prioritize so you can better manage your cash flow.
By letting an A/R software like Upflow create this visual representation of your invoices for you, you can focus your energy on sending payment reminders to your past-due clients.
You could even automate this by setting up a specific email workflow for late payers:
You can set it up as a subgroup and have emails sent automatically before their due date and/or
You can send one or a series of automated emails right now to customers with unpaid invoices.
Once you’ve freed yourself from having to track your KPIs for accounts receivable, you can actually act on them and course correct immediately.
Creating Billing Cohorts Easily With Upflow.
A billing cohort is a super-tool that ties all your accounts receivable processes together. It allows you to track invoices sent together (in the same billing cohort) over time. See an example from our product below.

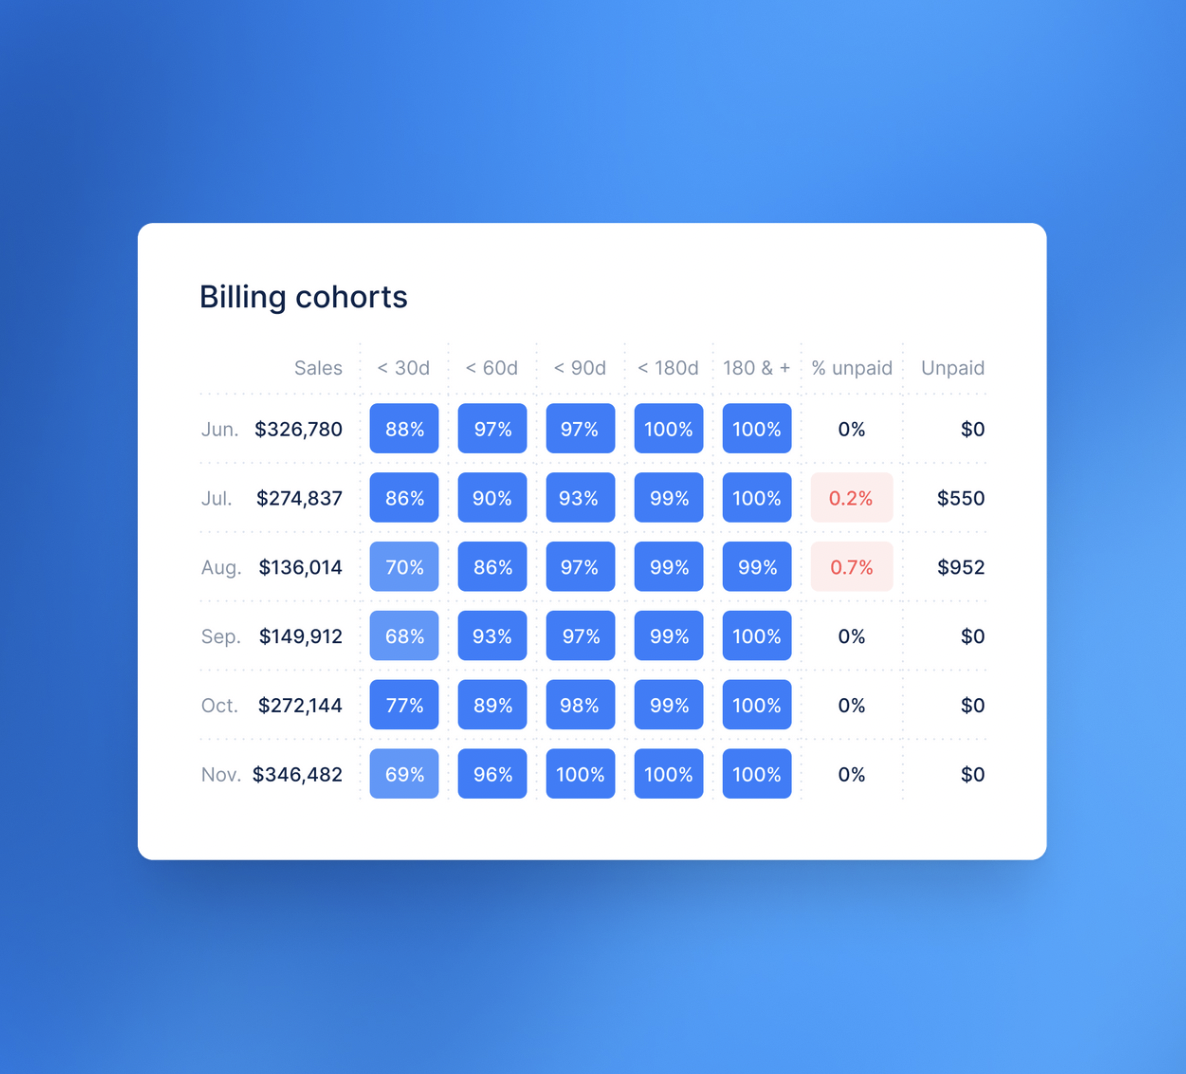
You can read the graph both ways to get an accurate picture of your A/R:
Horizontally: see how fast your invoices are collected.
Vertically: see how your collection improves with time.
It’s a handy feature to have as it gives you an overview of your whole collection process.
On Upflow, you have access to it on your dashboard. You can also click on each billing cohort to see which accounts are currently overdue. Once more, time not spent on tracking metrics manually is time you can spend on actually improving your collection.
These are just a few of the things you can track (and do) with Upflow. Imagine what you could do with all the time it frees you! Try out our free tool to get an idea.
Key Takeaways:
While Excel spreadsheets have their uses, they are limited when it comes to tracking your accounts receivable metrics. The manual process is error-prone, inaccurate, and time-consuming.
Using your billing software analytic features doesn’t give you the depth you need to optimize your AR metrics. They are not designed for accounts receivable collection and are therefore limited in how they can help you.
Switching between different tools to access different AR metrics is tempting, but ultimately it is a make-shift solution that isn’t efficient.
Building your own AR dashboards is both time and cost-consuming. It also means taking on a huge technical responsibility (which isn’t your job). While the customization looks good on paper, it doesn’t stand the test of time, as your business needs will evolve.
The best way to monitor your AR KPIs is to use automated AR software. They’ll do the calculation and tracking for you, while also offering you relevant features to optimize your AR process.