
Having a fancy AR dashboard is great! But what does it help with exactly? Tracking AR metrics helps to know what’s going on in your business and how efficient your collection process is.
Overall, monitoring your accounts receivable KPIs is essential to:
Manage your cash flow.
Make sure your AR strategy works.
Information is power, and reliable data assists you in smart decision-making.
While tracking these metrics helps sharpen your strategy, the way they are tracked isn’t always cutting-edge. Some financial teams still rely on manual spreadsheets to track their AR metrics, while others use an in-built feature of one of their already existing software. These options are neither the most efficient nor the most reliable.
The best option to monitor these important KPIs? It’s having a dedicated AR dashboard. One that’s specially designed for this purpose. As such, it will offer all the relevant reports you need to stay on top of your accounts receivable process.
That’s where we come in! Upflow is an AR software that allows you to get paid more easily and more quickly. Our in-house tool offers a dedicated analytics feature that allows you to track your AR reports metrics easily.
That includes:
Cash forecasting,
Billing cohorts,
DSO reports
And much more!
Curious to know more about AR dashboards in general, and what we offer specifically? Keep reading!

B2B Companies: Which AR Metrics Should You Be Tracking?
Before we get into the specificities your AR dashboard should have to foster your growth, let’s take a moment to see which metrics to track in the first place:
Days Sales Outstanding.
Your days sales outstanding is the average number of days it takes your customers to pay you. It’s a great indicator of your future cash flow and it helps prevent any liquidity problems.
You get it by making a ratio between your accounts receivable and your sales over a time period. You can calculate it using the simple method, or the countback method.
Not sure which one to use? Read about the best way to calculate your DSO.
Using AR software means you can use the most accurate method without having to spend a lot of energy calculating it. It’s more time spent on actually improving your DSO!
Upflow’s tip: Ideally, you want your DSO to be as close to your payment terms as possible. When your DSO is on the higher side, that’s when liquidity problems start to arise. If that’s your case, look into improving your Dso as soon as possible.
Aging Reports.
Your Aging report is a visual representation of the unpaid invoices classed in different categories:
0 to 30 days,
30 to 60 days,
60 to 90 days,
+ 90 days.
Concretely, an aging report is a list of the invoices your clients haven’t paid yet, with details such as your customers’ contact, the amount due, and the invoice's original due date. At a glance, you can see within which category invoices are piling up. An AR software will generate this report for you automatically, so you can quickly identify your risky accounts.
Aging reports help finance teams decide which invoices are a priority to collect to prevent unpaid invoices on your end.
Upflow's tip: Keeping a close eye on your 60-90 days bucket is essential, as it’s an indicator of a possible future cash flow problem and bad debt risk.
Need help calculating your top AR metrics? Have a look at our free spreadsheet.

Accounts Receivable Turnover Ratio.
Your accounts receivable turnover ratio measures how well your company collects money from its customers. An account receivable is basically a credit extended to your clients. Your turnover ratio measures how well this debt is collected.
Upflow's tip: A high turnover ratio is what to aim for, but not too high. You want to strike the right balance between making it easy for your customers to buy from you, but not being too generous with your credit terms.
Collection Effectiveness Index.
Your Collection Effectiveness Index (CEI) tracks how much of your accounts receivable was collected over a given time period. It compares the accounts receivable that were collectible to the ones that were actually collected.
It’s complementary to your DSO, which doesn’t actually take into account when invoices are paid or the amounts due.
Upflow tip: The closer your CEI is to 100%, the better - and it should always be over 80%!
Average Day Delinquent.
Average Day Delinquent (or ADD) tracks how efficient your AR process is. It doesn’t take into account your invoices paid within your payment terms, just the ones that are late.
It’s expressed in the average number of days it takes your company to collect those late invoices. To do that, you use both your DSO and your best possible DSO (which uses your current accounts receivable).
Your Average Day Delinquent shows how effective your collections processes are at turning your accounts receivable into cash. A high ADD means your customers take a long time to pay you.
Contrary to your DSO which covers a period of time, your ADD tells you how late your unpaid invoices are paid at the moment. That’s why it’s important to look at both to get an accurate picture of your AR process.
Upflow’s tip: It’s important to be proactive about your collection by optimizing your billing process. You can also set up automatic payment reminders to collect your invoices more quickly.
Cash Forecast.
Cash forecasting isn’t a metric per se, but it’s a great feature some AR software (like Upflow!) have.
With cash forecasting, you can know exactly how much cash you will have at a given time. That’s helpful for:
Better cash management,
Problem-solving,
Stakeholder satisfaction,
Forward planning.
It’s something you can calculate manually, using the direct method or the indirect method.
While they’re easy on paper, they’re however not as easy to concretely calculate. They require chasing data from your financial statements and/or your bank account and are error-prone. The alternative is to use an AR software that does that for you.
Upflow has a built-in cash inflow feature (see picture below): based on your previous sales and AR collection speed, our software is able to forecast automatically how much cash will come in in the next 90 days.

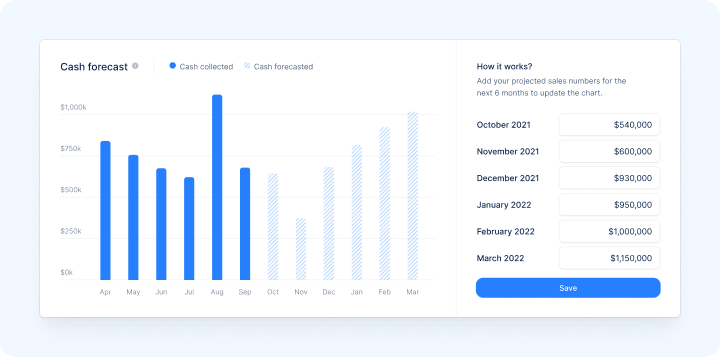
Balance this with your expenses and accounts payable to get a complete cash flow forecast! Cash forecasting is essential to any business and especially fast-growing ones.
Upflow tip: if you want to get more predictability in your cash flow, consider implementing (or improving) a subscription-based business model.
Billing Cohorts.
Billing cohorts are graphs of your invoices gathered in different groups, alongside the cumulative percentage of invoices that were paid (see example below)

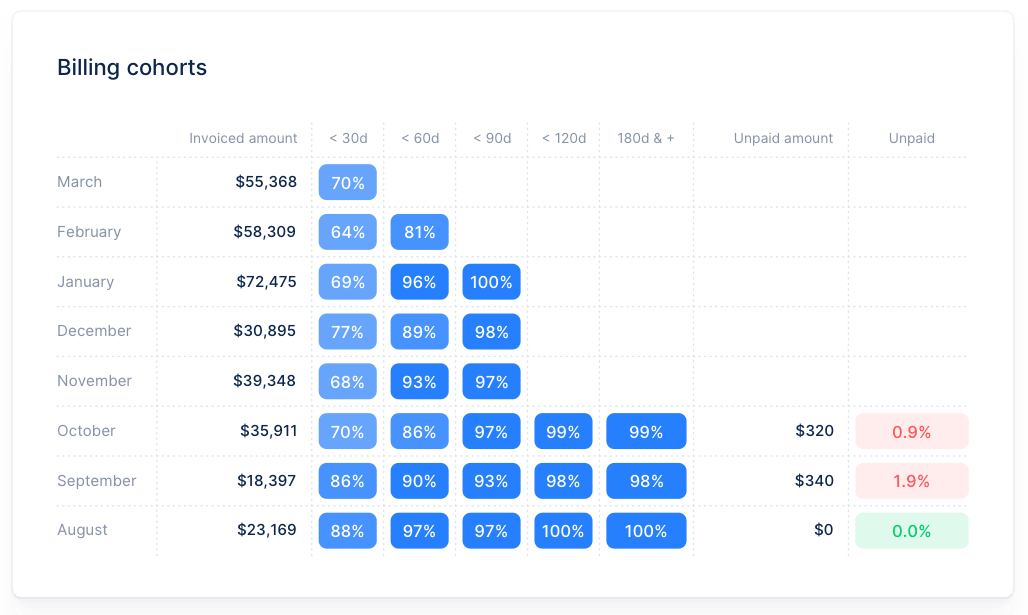
You can read them horizontally and vertically:
Horizontally, it tells you how efficient your collections processes are.
Vertically, it tells you if your collection processes improved with time.
Billing cohorts tie everything together! It’s the super-tool that gives you an overview of how well your accounts receivable processes are performing. It’s usually computed by software, but you can do it manually (or on spreadsheets) by grouping all the invoices sent on a given month together. Then, you need to calculate the cumulative percentages of the paid invoices within the different time brackets.
The easier alternative is to use an AR software, which allows you to spend more time on improving your AR process! If you use Upflow, you can click straight on your billing cohorts to see which accounts are outstanding.
Upflow's tip: Checking your billing cohorts regularly (daily or weekly) is important to stay on top of things and make sure you don’t encounter any cash flow problems.
All these metrics and visual representations together will give you an accurate idea of how well your accounts receivable processes are doing. Need help tracking them? Have a look at our free spreadsheet

Stop Tracking Your AR Metrics Manually!
As you’ve seen, there are a few metrics to track in your business - and they’re just our list of essentials!
While we could say that it’s perfectly acceptable to calculate them manually or using spreadsheets, we really don’t think it’s the best move for you. Here’s why:
It’s time-consuming: calculating any and all KPIs manually or using excel formulas means you’ll have your hands full. It takes a lot of time to find the correct number, do the calculation, write it down… and do it all over again when you want the newest numbers. Honestly, we think you have better things to do with your time (like strategic planning)
It’s error-prone: doing it manually increases your probability of getting it wrong. Inaccuracy in your results can come from a simple computing mistake (we’re all humans) but also from incorrect numbers. There is little point in dedicating time to your AR collection if you’re not able to accurately track your progress.
It’s not accurate: if you need to chase your data over different sources, then it’s very likely that your results won’t be accurate. Even with the best intentions, jumping through hoops to find the latest accurate data rarely amounts to accurate calculations.
It’s difficult to interpret: comparing all your metrics isn’t as easy when you’re juggling different spreadsheets or software. And what if you suddenly need to adjust a variable? It means starting it all over again. Having all your AR metrics within one ar dashboard makes more sense, as you can compare your data easily in a few clicks.
Now that we’ve looked at the reasons not to use spreadsheets to get your AR metrics, let’s deep dive into the alternative: automated software!
Why Are Automated Accounts Receivable Dashboards Better for Your Growth?
The short answer to this question is: accounts receivable software will make your job so much easier. It will free up your time that can in turn be used for planning for your growth.
For the detailed benefits of using software, read on!
The Benefits of Using Software for your Accounts Receivable Dashboard.
1. AR Software is Designed for AR Dashboards.
Sure, spreadsheets are versatile. They can also get complicated and not very user-friendly, plus all the other cons we saw before.
What about using a billing tool or accounting software? While those are a must-have for any business, they are not specifically designed for accounts receivable collection.
Their features are therefore limited and so are the dashboards they offer. This means to get to a dashboard with all the metrics you need, you’ll need several tools, at best. And… we’re back to a complicated process that requires switching back and forth.
AR software like Upflow on the other hand has been created with your accounts receivable in mind. Its sole purpose is to streamline your collection process.
That shows up in:
The features that are offered: you get a dashboard with all your AR metrics and many features, including drill-down (which allows you to zoom in on any metric with a simple click on your dashboard) and some personalization on your dashboard and in your reports.
The way it’s all presented: say bye-bye to complicated navigation and welcome to a good user experience, making your ar experience much smoother for you and your collaborators.
2. AR Software Centralizes your Data.
Your AR software is a building block in your finance stack. Because it integrates with your other software like your accounting tool, billing software, and even CRM, it gets your data in real-time.
As we are a SaaS, our tool also grows with your business needs over the years.
Having one source of truth when it comes to your accounts receivable process makes it easier to work on it - individually and at your company’s scale.
You know the information you get is always up-to-date and reliable as Upflow automatically synchronizes your data across your finance stack - not just once a day.
On Upflow, you can also leave internal reminders to your team and attribute tasks to different people. It is your hub when it comes to your AR collection.
3. AR software Optimizes your Metric Tracking.
Because the information is in real-time and readily available, the dashboard creation can be automated too. On Upflow, you can compare your DSO over different periods, and have an overview of your aging report in a few clicks.
That’s also handy for report creation, as you can create the one you need quickly. Perfect for any last-minute meeting!
All of this saves you time and energy that can be spent on actually implementing strategies to improve your company’s financial health.
How to Build the Best Automated AR Dashboard?
You could spend weeks designing your perfect AR dashboard, using different software and integrations to be exactly as you want it.
Or … (you know where we’re going here, right?) you could use an already-made software.
Once more, it depends on your priorities. But we bet that building an in-house automated AR dashboard isn’t the best use of your time or your developers' time. As your company grows, it’s crucial to learn to decipher what’s important to do yourself and what’s best to delegate or when it’s time to make use of automation. We believe that AR dashboards are part of the latter category.
When you use Upflow, it is our responsibility to make sure our product works for you. If there is any technical problem, you contact us and we’ll sort it out.
If your in-house dashboard stops working on the other hand… that’s on you, and that might not be on everybody’s top priority list. It also means we are in charge of producing all the documentation and faqs your team might need.
On top of tracking metrics, Upflow offers a complete solution to optimize your accounts receivable. We help you optimize your process from beginning to end - that includes payment reminder templates to send to your clients, too.
Key Takeaways:
AR metrics are essential performance indicators to track in any business, but even more when you grow fast, as cash flow can quickly become a problem.
Tracking your AR KPIs ensures your company doesn’t encounter any liquidity problems and manages its cash flow in the best way possible to reduce overdue receivables.
We recommend tracking the following 7 AR metrics: DSO, CEI, aging report, billing cohort, turnover ratio, cash forecast, ADD.
The manual process of calculating them takes a lot of time and is error-prone. It’s better to use an AR software that will do that automatically with the latest data.
Building an AR dashboard template yourself isn’t the best use of your time either, and it means an added responsibility in case of technical problems.
Automated AR software like Upflow are perfect for creating AR dashboards and reports. We make tracking your KPIs easy, so you can spend more time on actual strategy and implementation.
Saving your team from tedious tasks means being able to optimize your whole AR process and ensuring your company’s financial health.