

TL;DR: A 13-week cash flow forecast is a rolling, weekly projection of cash in and cash out over the next quarter, built with the direct method. In a B2B tech company the outflows are mostly known weeks ahead, so the forecast succeeds or fails on customer receipts. Build that line invoice by invoice from how each customer actually pays, then review the variance with your collections team every week.
A 13-week cash flow forecast is a weekly projection of the cash a business expects to receive and pay out over the next 13 weeks, starting from the cash it holds today. It uses the direct method, so it tracks actual receipts and payments rather than accounting profit, and it rolls forward one week at a time.
Most templates treat customer receipts as one line, driven by days sales outstanding (DSO) or by invoice due dates. That is the weakest assumption in the model. Payroll and rent land on dates you already know. What your customers pay, and when, is the part you are guessing, and in a B2B tech company it is usually the biggest number on the page. This guide shows how to build the receipts line from invoice-level AR data and real payment behavior, and how to run the weekly review that keeps it honest.
What is a 13-week cash flow forecast?
It is a short-term liquidity tool. Each column is a week, each row a source or use of cash, and the bottom line is the cash you expect to hold at the end of each week.
The difference from the monthly forecast your FP&A team already runs is granularity. A weekly view catches the payroll Friday that falls before a large customer payment, which a monthly total hides. Because it is built on the direct method, non-cash items such as depreciation never appear.
The format grew up in restructuring. Wall Street Prep still describes it as a tool used “in the context of corporate restructuring”, where lenders and courts want weekly proof of liquidity. That history explains why so many templates look the way they do. It does not mean you need to be in trouble to use one. Advisory firm Cherry Bekaert argues that running it proactively, before any distress, is what prevents the liquidity crunch in the first place.
Why 13 weeks?
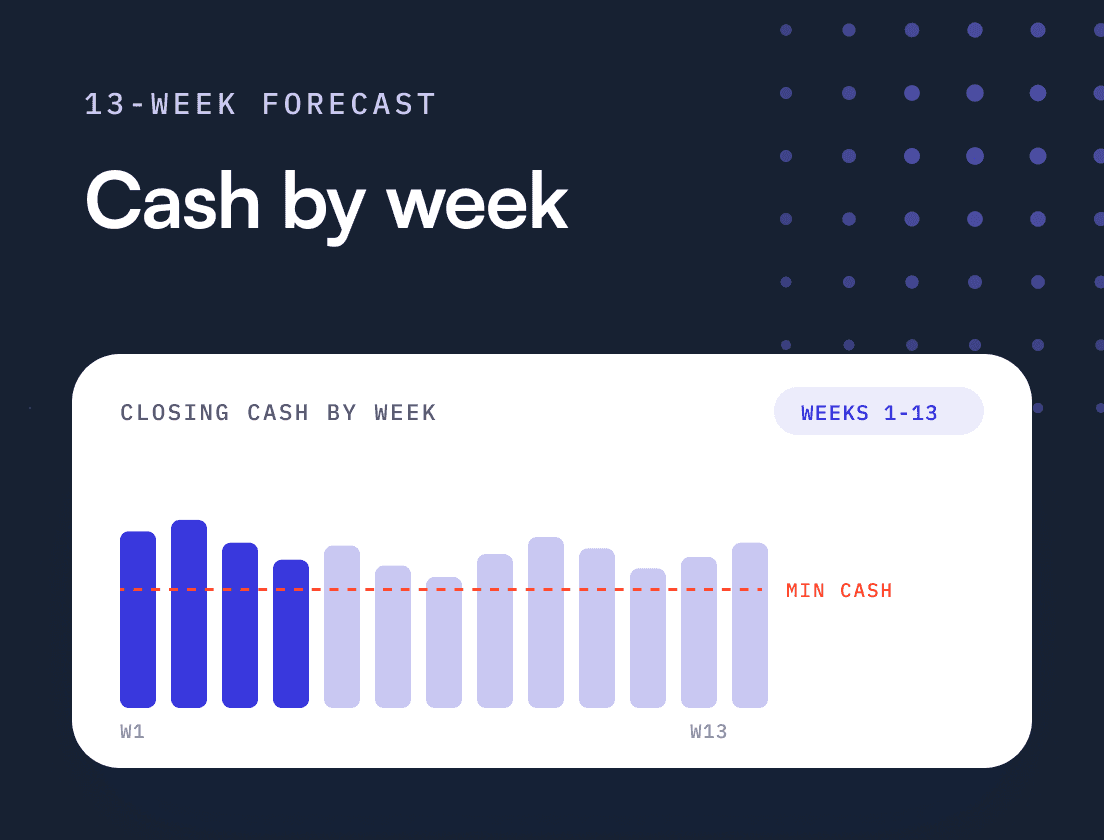
Thirteen weeks is one quarter. It is short enough that most of the inputs are things you already know, such as invoices already issued and payroll already scheduled, and long enough to arrange financing or change spending before a shortfall arrives.
Precision falls off across the horizon. The first four weeks should be close to exact, while the last few are directional. That is fine, as long as everyone reading the forecast knows which weeks are commitments and which are estimates.
The appetite for this kind of visibility is not limited to companies in distress. In the 2026 AFP Treasury Benchmarking Survey, based on 425 treasury practitioners, cash and liquidity forecasting was both the most challenging treasury activity (49%) and the top priority overall (63%).
What goes into a 13-week cash flow model?
The layout is simple. Keep receipts split by source, because each source behaves differently.
| Row | What it contains | Where the data comes from |
|---|---|---|
| Opening cash | Bank balances at the start of the week, reconciled | Bank feeds |
| Receipts from open AR | Expected payment on invoices already issued | AR ledger, invoice by invoice |
| Receipts from future billings | Cash from invoices you will issue during the 13 weeks | Billing schedule and contract renewals |
| Other receipts | Tax refunds, interest, asset sales | Known items only |
| Payroll and benefits | Salaries, payroll taxes, benefits | Payroll calendar |
| Vendors and software | Supplier payments, cloud hosting, subscriptions | AP aging and payment runs |
| Rent, tax and debt service | Fixed obligations | Leases, tax calendar, loan schedules |
| One-off items | Capex, bonuses, legal settlements | Leadership input |
| Net cash flow | Receipts minus disbursements | Calculated |
| Closing cash | Opening cash plus net cash flow | Calculated, compared with your minimum cash threshold |
How do you forecast customer receipts accurately?
Forecast each open invoice on the date that customer is likely to pay it, not on its due date and not from an average. Then adjust for the two things that take cash out of the base case: open disputes and payments you have already received but not yet matched.
The usual approach spreads receivables with DSO. Take $6.0M of open AR and a DSO of 52 days, and the model collects about $808,000 every week. The number is smooth and easy to defend in a meeting. It is also wrong in almost every individual week, because DSO is an average across customers who behave very differently. Your largest enterprise account may pay three weeks after due date as a matter of AP policy. Your mid-market customers on card autopay pay on the day. The average describes neither. Our guide to accounts receivable forecasting covers the methods behind this in more depth.
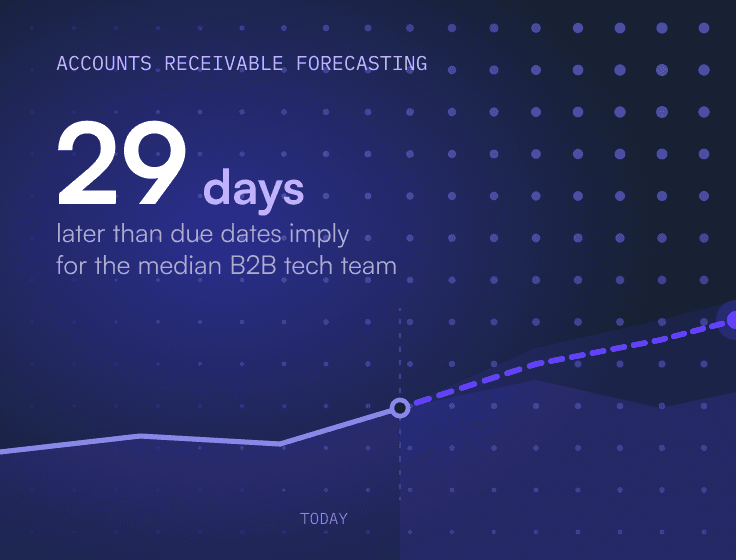
The scale of late payment makes this more than a rounding issue. Atradius found in its 2026 US survey that late payments affect an average of 22% of US B2B receivables, and that about seven in ten companies still face them. In Upflow’s own research across thousands of B2B tech finance teams, published in From Zero to Collected, the median company would have a DSO of 23 days if every customer paid on the due date, against an actual median of 52. That 29-day difference is time your forecast has to place somewhere, and due dates put it nowhere.
A DSO of 52 days is the median in Upflow’s research, so the first question is where your own sits. Our free DSO calculation spreadsheet gets you the number in minutes.

Here is the method.
- Start from open invoices, not the aging total. Pull every open invoice with customer, amount, due date and status. Remove credit notes and anything written off, since they clear a receivable but bring in no cash.
- Give each customer a payment profile. For each customer, take the median number of days between due date and payment across their last six to twelve paid invoices. For customers with too little history, use the profile of their segment.
- Set an expected payment date for each invoice. Due date plus the customer’s typical days late. If the customer has given a promise to pay, use that date instead.
- Take disputed invoices out of the base forecast. A disputed invoice will not pay on its normal pattern. Hold it in a separate row, and only move it back once the dispute has an owner and a resolution date.
- Remove unapplied cash. Payments received but not yet matched to invoices still show as open AR. That cash is already in your opening balance, so forecasting it again counts it twice.
- Forecast future billings with a collection curve. For invoices you have not issued yet, use the share of each billing month historically collected by week. In tech companies with annual upfront billing, map renewal invoices to their actual dates, because January and fiscal year ends can concentrate a quarter’s receipts in a few weeks.
If you run Upflow, Upflow Insights covers the inflow side of this. It forecasts cash based on how customers really pay, informed by promise-to-pay dates and detected disputes, and layers in upcoming billings to forecast past your current AR.
A worked example: six invoices, two weeks
Take a B2B tech company with $40M in annual recurring revenue. Here are six items from its AR ledger that fall due in weeks 1 and 2 of the forecast. The figures are illustrative.
| Item | Amount | Due | What the AR data shows | Due-date forecast | Invoice-level forecast |
|---|---|---|---|---|---|
| Enterprise customer A | $420,000 | Week 1, day 3 | Pays a median of 19 days late | Week 1 | Week 4 (day 22) |
| Mid-market customer B | $85,000 | Week 1, day 4 | Pays a median of 2 days late | Week 1 | Week 1 (day 6) |
| Mid-market customer C | $140,000 | Week 2, day 10 | Promise to pay on day 17 | Week 2 | Week 3 |
| Enterprise customer D | $210,000 | Week 2 | Disputed: wrong PO number on the invoice | Week 2 | Out of the base forecast until resolved |
| 40 long-tail invoices | $160,000 | Week 1 | Historically 70% of value paid by the end of the following week | Week 1 | $112,000 by week 2, $48,000 in weeks 3 to 6 |
| Mid-market customer F | $65,000 | Week 1 | Paid last week, sitting in unapplied cash | Week 1 | $0 (already in opening cash) |
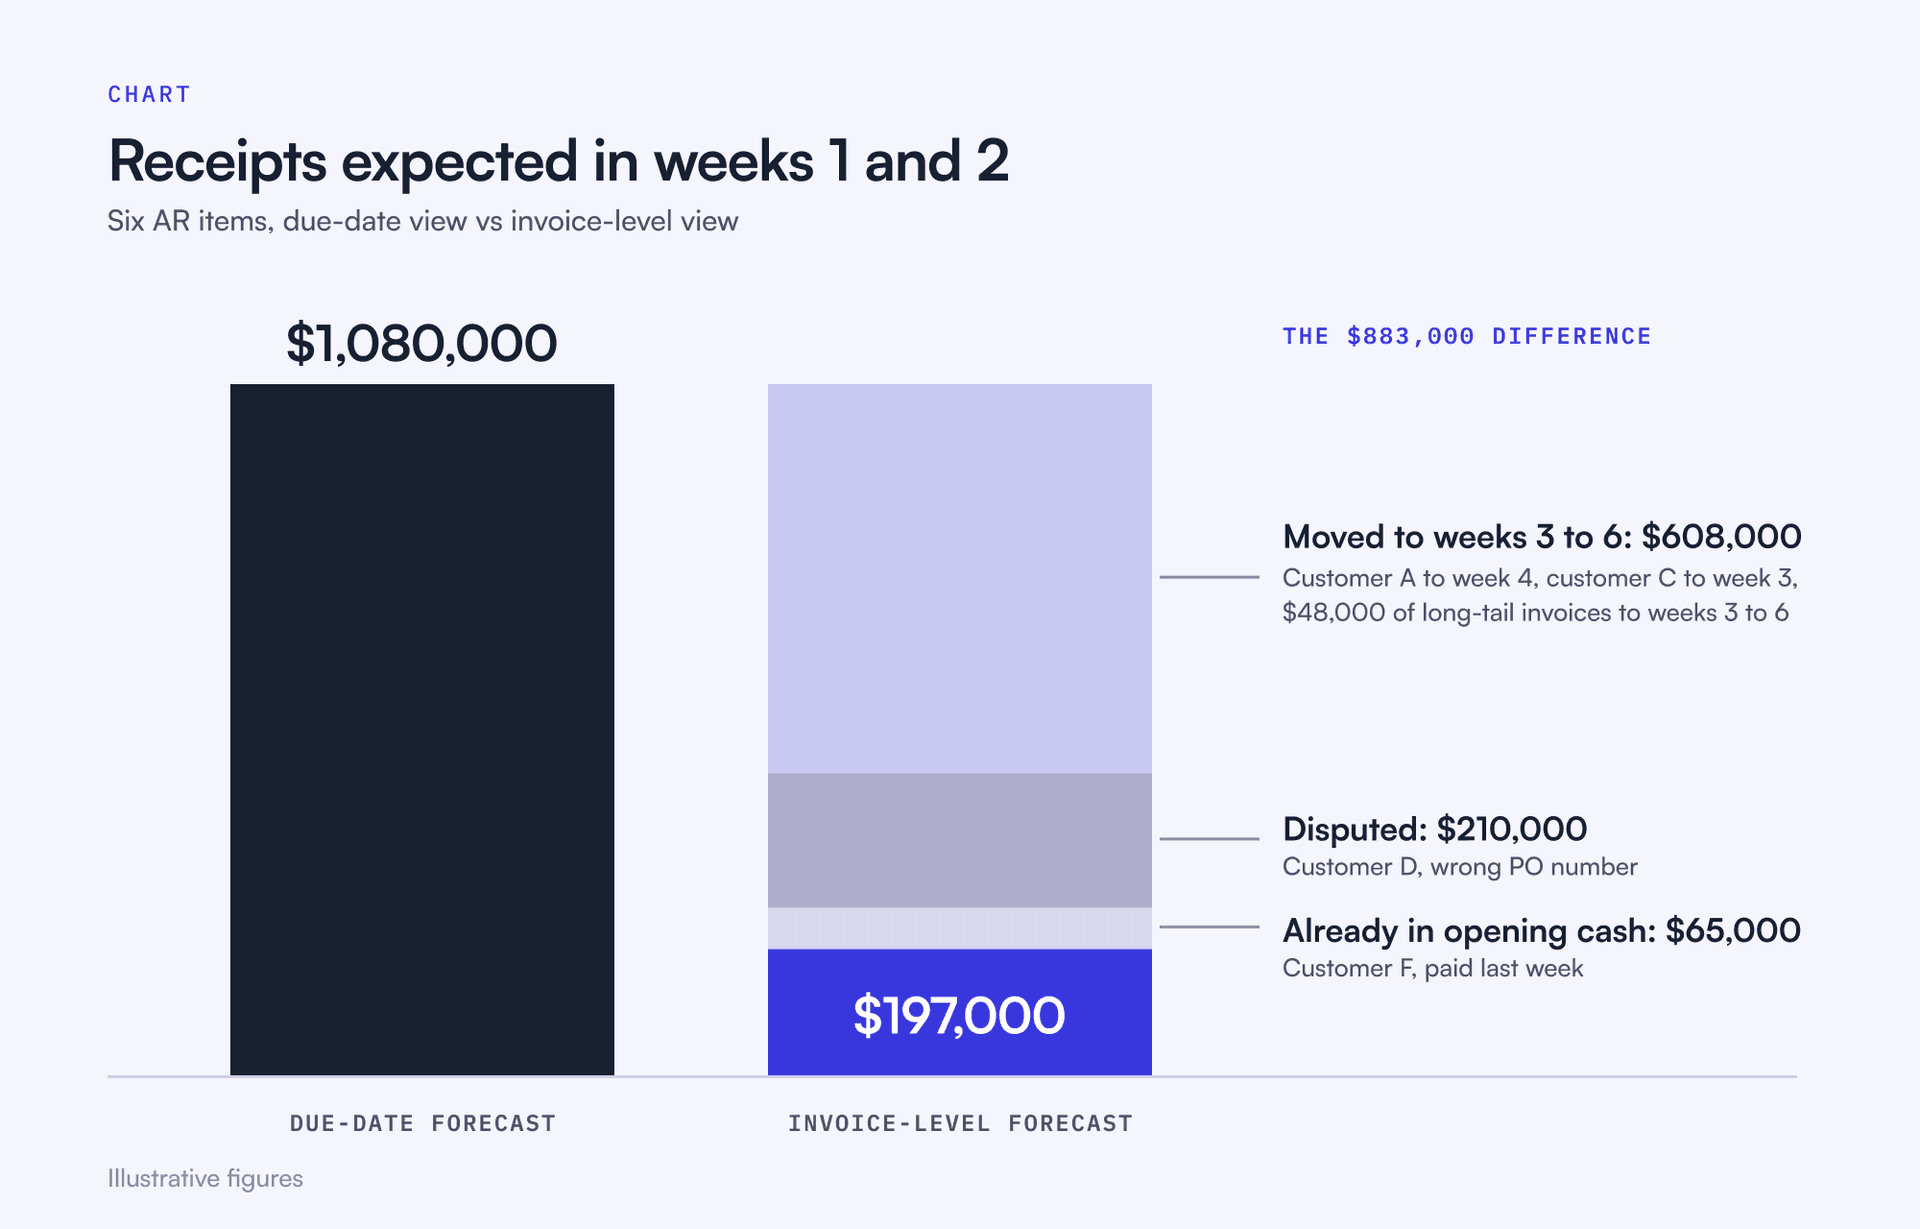
The due-date view expects $1,080,000 from these items in weeks 1 and 2. The invoice-level view expects $197,000: customer B’s $85,000 plus $112,000 from the long tail.
The other $883,000 has not disappeared. $608,000 moves later inside the horizon (customer A to week 4, customer C to week 3, $48,000 of long tail to weeks 3 to 6). $210,000 waits on a dispute. $65,000 is already in the bank. But if week 2 is a payroll week and your minimum cash threshold is tight, those two views lead to very different decisions.
How do you forecast disbursements?
Keep this part simple, because it is the part you control. Payroll comes from the payroll calendar, vendor payments from your AP aging and payment run schedule, and fixed obligations from their contracts. One-off items, such as annual bonuses or a large software renewal, need a named owner who confirms them each week. Most disbursement errors trace back to items nobody told finance about.
How to build a 13-week cash flow model step by step
- Reconcile opening cash. Use cleared bank balances on the first day of week 1, not the general ledger.
- Load open AR at invoice level and apply the receipts steps above.
- Add future billings with a collection curve built from the last four to six billing months.
- Add disbursements by category, each on its own row.
- Calculate closing cash for each week and compare it with your minimum cash threshold or covenant.
- Save a copy of this version before you change anything next week. You cannot measure variance against a forecast you have overwritten.
How do you roll the forecast forward each week?
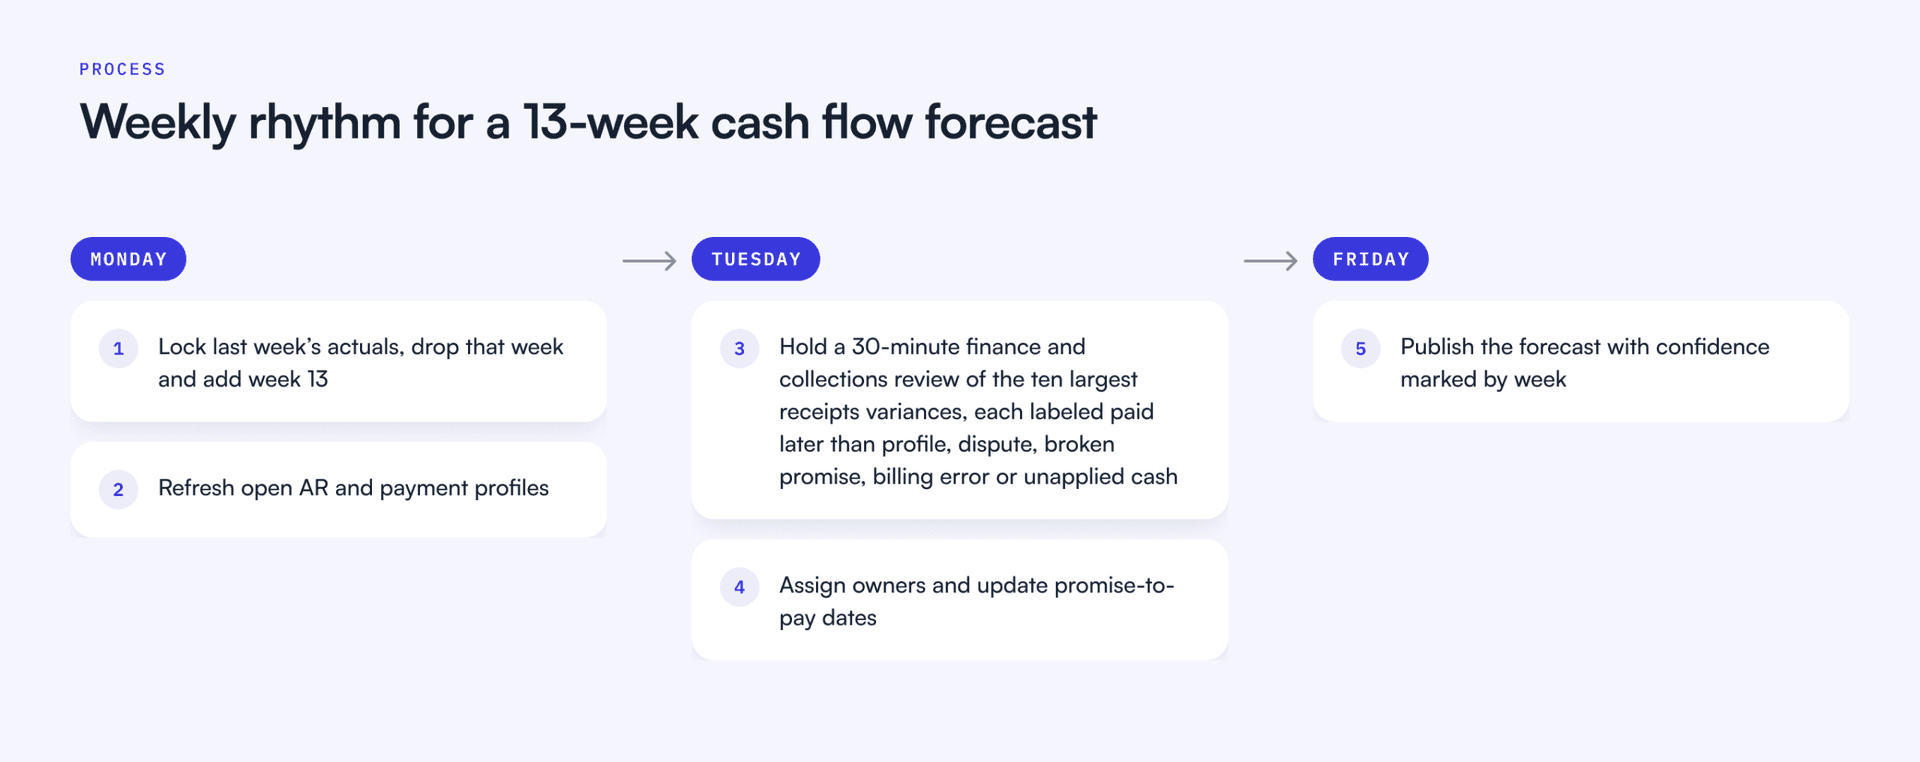
Rolling forward is two jobs: replace last week’s forecast with actuals and add a new week 13. Then compare what you expected with what happened, line by line, before you touch any assumption.
Measure receipts accuracy as the absolute variance divided by actual receipts for each week, and track it for weeks 1 to 4 over time. There is no widely accepted independent benchmark for 13-week forecast accuracy at mid-market scale, so set your own tolerance band and tighten it as the model improves.
The more useful habit is a 30-minute weekly meeting between whoever owns the forecast and whoever owns collections. Bring the ten largest receipts variances by customer and label each one: paid later than profile, dispute, broken promise to pay, billing error, or unapplied cash. Each label has its own owner and fix. A broken promise goes back to the collector that week. A billing error goes to billing operations. A customer whose days late keep growing goes to their account owner before the renewal conversation.
This is where the forecast becomes a collections tool. From Zero to Collected treats promises to pay kept and accounts paying later than before as live signals to check every week, while there is still time to act. The forecast variance is the same signal expressed in cash. Christina Liu, CFO at Sigma Computing, put the cross-team point plainly when talking about how finance and sales work together: “The transparency and the visibility drives accountability, which is the common language between finance and sales.”
This shared ownership is the core of Financial Relationship Management (FRM), the discipline of managing the financial relationship with a customer, from the moment payment terms are agreed until cash is collected and reconciled. Applied to a 13-week forecast, it means the receipts line belongs to finance and collections together.
What mistakes make a 13-week forecast drift?
- A DSO plug for receipts. It hides customer concentration and timing.
- Due dates treated as payment dates. With late payments touching more than a fifth of US B2B receivables, this is optimism built into a formula.
- AR balance confused with cash. Credit notes and write-offs clear a receivable but bring in nothing, and unapplied cash is already in the bank.
- No saved versions. Without last week’s forecast, there is no variance and nothing to learn from.
- One owner. A forecast built by FP&A alone misses what the collections team heard on this week’s calls.
Do you need a 13-week cash flow template or software?
A spreadsheet is fine for the model itself, especially for disbursements, which are known in advance. The problem is the receipts input. If someone exports an aging report every Monday and rebuilds payment profiles by hand, the forecast is only as fresh as that export.
The PwC 2025 Global Treasury Survey of 350 treasurers points the same way: poor data quality (76%) was the most cited obstacle to better forecasting, ahead of a lack of effective tools (53%). Among companies with more than $1 billion in revenue, 38% to 52% still collect forecast data manually, which PwC links to low satisfaction scores (2.9 out of 5, against 3.3 for integrated or system-based forecasting).
So keep the template, but feed the receipts rows from your AR system at invoice level, refreshed weekly. Upflow syncs two ways with ERPs such as NetSuite and Sage Intacct and with CRMs such as Salesforce and HubSpot, so open invoices, promises to pay, disputes and account owners sit in one place. Upflow Collections is where the team works the gaps the forecast exposes, and Upflow’s MCP server brings that receipts view into Claude, ChatGPT or Copilot to build the wider cash picture.
For a broader view of forecasting methods beyond the 13-week format, see our guide to cash flow forecasting.
Before changing the process, it helps to see how your receivables behave today. Connect your ERP or billing tool to Upflow Discover and see your DSO and other AR metrics for free.


Alexandre Antoine
Finance Director at Upflow
Alexandre is the Finance Director at Upflow, where he leads the company’s internal finance and accounting operations. With a background in both strategic finance and financial reporting, Alexandre brings a practical, detail-oriented approach to the complexities of B2B finance.
At Upflow, Alexandre ensures that internal processes from cash management to KPI reporting are optimized for transparency, accuracy, and growth-readiness. He helps build scalable finance systems that support Upflow’s mission to empower other finance teams through better collections and cash flow insights.
Alexandre regularly contributes to Upflow’s blog with in-depth articles on accounting metrics, financial ratios, reporting best practices, and operational benchmarks. His writing provides actionable advice for controllers, FP&A teams, and finance leaders navigating complex financial processes.

Summary

Shared
Frequently Asked Questions
Can’t find what you’re looking for?
Ask AI


A 13-week cash flow forecast is a weekly projection of the cash a business expects to receive and pay out over the next quarter. It starts from today’s bank balance and uses the direct method, so it shows real receipts and payments rather than accounting profit. Finance teams update it every week, replacing the oldest week with actuals and adding a new week at the end.
Thirteen weeks equals one quarter. The horizon is short enough that most inputs are known, such as issued invoices and scheduled payroll, and long enough to arrange financing or cut spending before a shortfall arrives. It also lines up with quarterly reporting, which is why boards and lenders often ask for it.
Start with reconciled opening cash. Forecast receipts from open invoices at invoice level, using each customer’s actual payment pattern, promises to pay and dispute status. Add future billings with a collection curve. Add disbursements by category from your payroll calendar and AP schedule. Calculate weekly closing cash, compare it with your minimum threshold, and save each version so you can review variance the following week.
A rolling forecast always looks 13 weeks ahead. Each week, the oldest week is replaced with actual receipts and payments, a new week is added at the end, and assumptions are updated based on the variance between forecast and actuals. A static forecast built once at the start of the quarter goes stale within weeks, which is why rolling is the standard practice.
In most mid-market tech companies, FP&A or the controller owns the model and treasury, where it exists, owns the cash position. The receipts line works best with shared ownership between finance and the collections team, since collectors know which customers have promised to pay and which have started to drift. A weekly 30-minute variance review is usually enough to keep both sides aligned.
There is no widely accepted independent benchmark for 13-week forecast accuracy at mid-market scale. A practical approach is to measure receipts variance for weeks 1 to 4 each week, as absolute variance divided by actual receipts, set a tolerance band your board and lenders accept, and tighten it over time. Expect weeks 1 to 4 to be close and weeks 9 to 13 to be directional.
Related articles